接到同事的通知,说mongodb的cpu很高,下不去,看有什么办法。
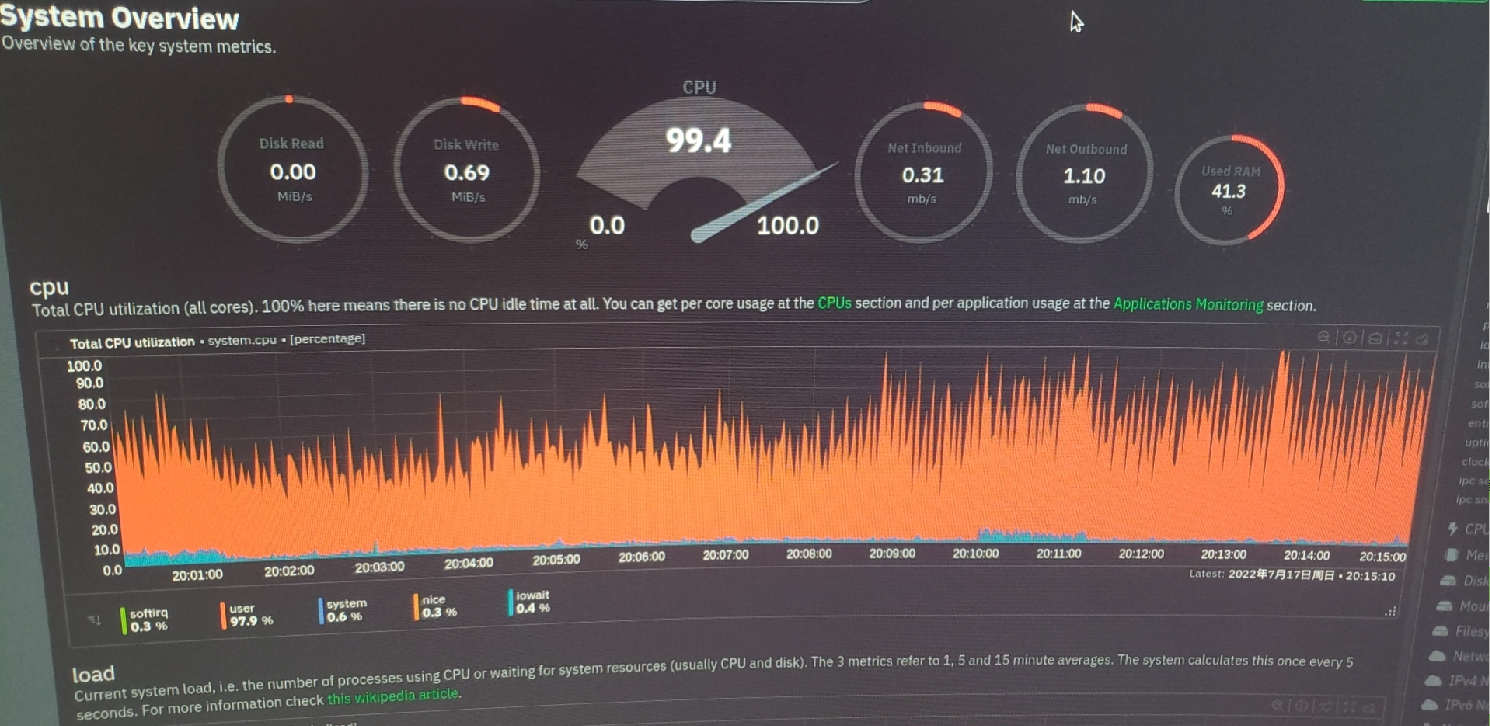
看了一下图,cpu都99.4%了,确实很高:
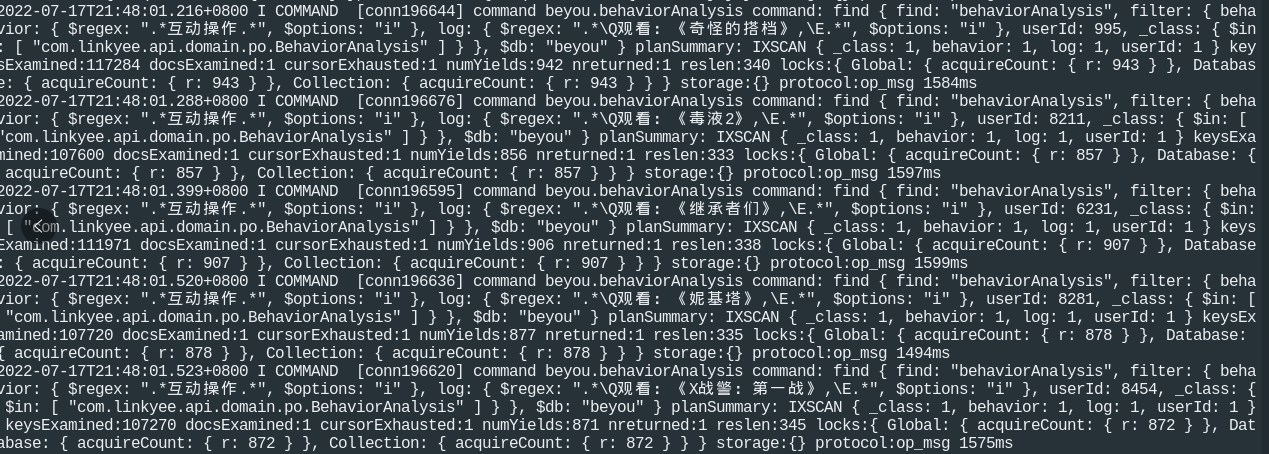
登上机器,首先去看mongod的log,都试如下的查询,都很慢:
copy出一条来,备用
12022-07-17T21:30:42.556+0800 I COMMAND [conn196670] command beyou.behaviorAnalysis command: find { find: "behaviorAnalysis", filter: { behavior: { $regex: ".*互动操作.*", $options: "i" }, log: { $regex: ".*\Q观看:《罗马的房子》,\E.*", $options: "i" }, userId: 7345, _class: { $in: [ "com.linkyee.api.domain.po.BehaviorAnalysis" ] } }, $db: "beyou" } planSummary: IXSCAN { _class: 1, behavior: 1, log: 1, userId: 1 } keysExamined:111564 docsExamined:2 cursorExhausted:1 numYields:890 nreturned:2 reslen:571 locks:{ Global: { acquireCount: { r: 891 } }, Database: { acquireCount: { r: 891 } }, Collection: { acquireCount: { r: 891 } } } storage:{} protocol:op_msg 2268ms
发现确实很慢啊,op_msg 居然要2268ms,但是mongodb的数据目录总共才6G多,不客观啊。
看看表结构和索引:
 1> show dbs;
 2admin   0.000GB
 3beyou   0.063GB
 4config  0.000GB
 5local   0.000GB
 6
 7> use beyou;
 8switched to db beyou
 9
10> show collections;
11activityLog
12behaviorAnalysis
13
14> db.behaviorAnalysis.find({},{_id:0}).limit(1);
15{ "name" : "812304163055734784", "createTime" : ISODate("2022-02-19T12:46:44.360Z"), "behavior" : "互动操作", "log" : "加入看单:《爱的迫降》", "userId" : 2, "_class" : "com.linkyee.api.domain.po.BehaviorAnalysis" }
16
17> db.behaviorAnalysis.getIndexes();
18[
19        {
20                "v" : 2,
21                "key" : {
22                        "_id" : 1
23                },
24                "name" : "_id_",
25                "ns" : "beyou.behaviorAnalysis"
26        },
27        {
28                "v" : 2,
29                "key" : {
30                        "_class" : 1,
31                        "behavior" : 1,
32                        "log" : 1,
33                        "userId" : 1
34                },
35                "name" : "_class_1_behavior_1_log_1_userId_1",
36                "ns" : "beyou.behaviorAnalysis"
37        }
38]
发现表结构不复杂,索引呢有两个,一个缺省的单字段索引_id,另一个是多字段索引,4合一的( _class、behavior、log、userId )
继续,来看看查询:
 1find {
 2  find: "behaviorAnalysis",
 3  filter: {
 4      behavior: { $regex: ".*互动操作.*", $options: "i" },
 5      log: { $regex: ".*\Q观看:《罗马的房子》,\E.*", $options: "i" },
 6      userId: 7345,
 7      _class: { $in: [ "com.linkyee.api.domain.po.BehaviorAnalysis" ] }
 8  },
 9  $db: "beyou" }
10  planSummary: IXSCAN { _class: 1, behavior: 1, log: 1, userId: 1 } keysExamined:111564
planSummary里,IXSCAN是查了索引,但是keyExamined居然有111564个,太多了吧。
再看看索引,明显4合一的效率有问题。
那就简单了,删掉这个4合一的索引,新建一个userId的索引,既然叫userId,那推测它是唯一的,重建索引需要后台执行,并且在业务不繁忙的时候再跑
1db.behaviorAnalysis.createIndex({"userId":1},{"name":'idx_userId',background:true,unique:true});
同事执行的时候报错:
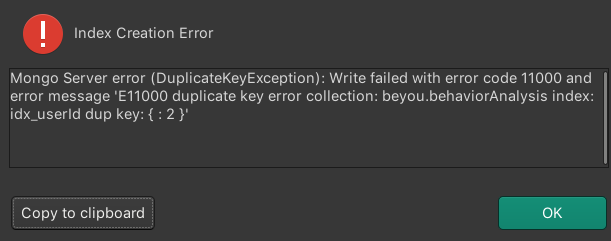
居然key重复了,那就把 unique:true 去掉了再执行,就成功了。
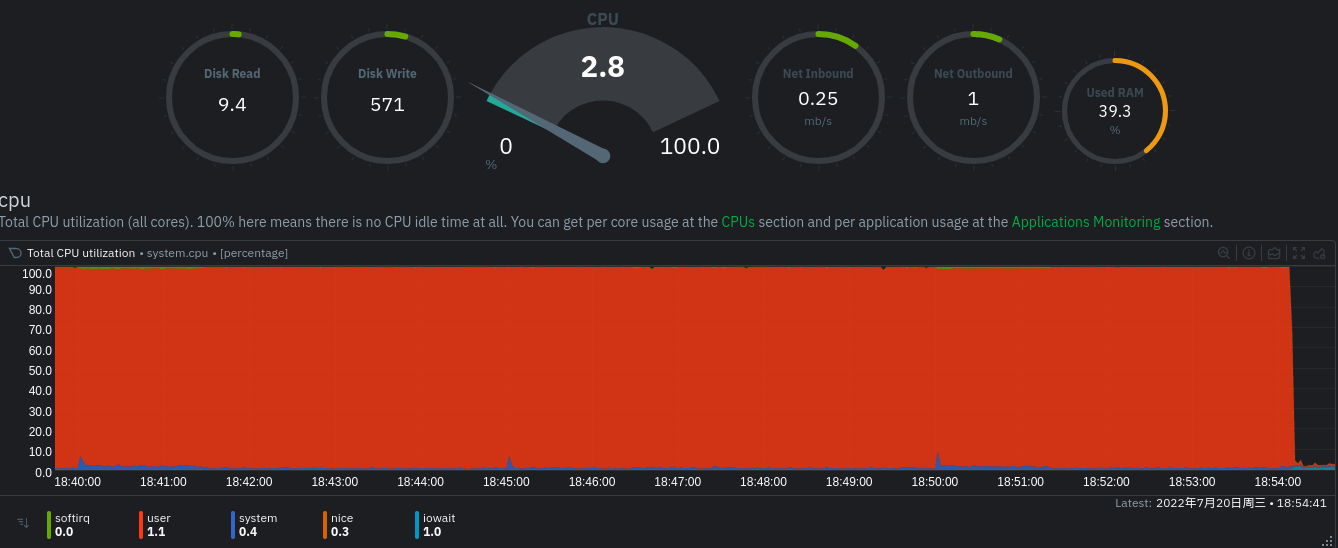
然后cpu就立竿见影,从100%降低到了2.8%
over,如果再遇到瓶颈,估计就只能采用分片大法了。